
Chart 1.5: Total National Health Expenditures (NHE) as a Percentage of Gross Domestic Product and Breakdown of Health Care Expenditures by Category, 2022

Source: Centers for Medicare & Medicaid Services, Office of the Actuary. Data downloaded August 2024.
Notes: Percentages may not come to 100% due to rounding.
Chart 5.2: Percent Change in Employment, Seasonally Adjusted: Hospitals vs. All Industries (Total Non-Farm), 2017-2023
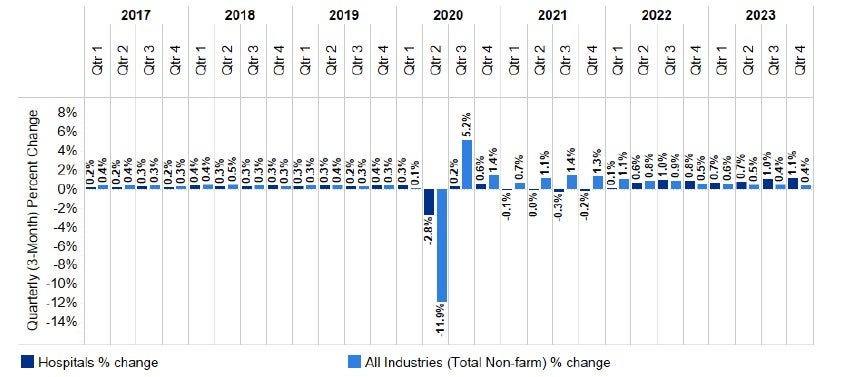
Source: Department of Labor, Bureau of Labor Statistics. Data downloaded August 2024. https://www.bls.gov/ces/
Notes:
(1) This data does not include government-owned hospitals.
(2) Employment includes only full-time workers.
Chart 5.6: Impact of Community Hospitals on U.S. Jobs, 2022
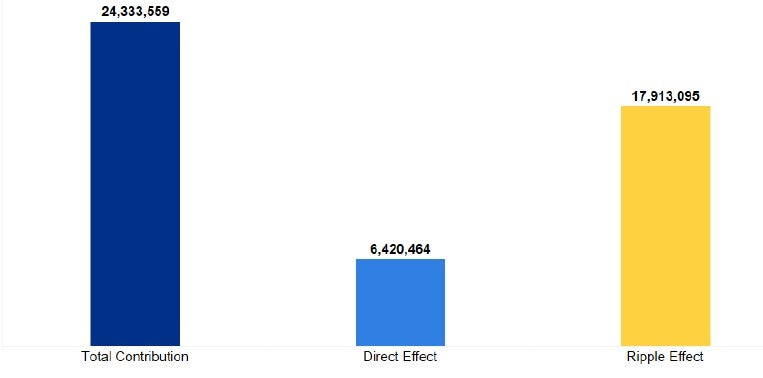
Source: This analysis used 2022 data from the American Hospital Association Annual Survey and applied 2022 Lightcast multipliers (released in 2023) to calculate economic impact.
Notes:
(1) Due to rounding, the sum of the direct and ripple effects may not equal the total economic contribution.
(2) Direct Effect includes full-time and part-time hospital jobs.
(3) Community hospitals include all non-federal, short-term general and specialty hospitals whose facilities and services are available to the public.