
Chart 1.2: Annual Percent Change in Total National Health Expenditures (NHE), 1980-2022
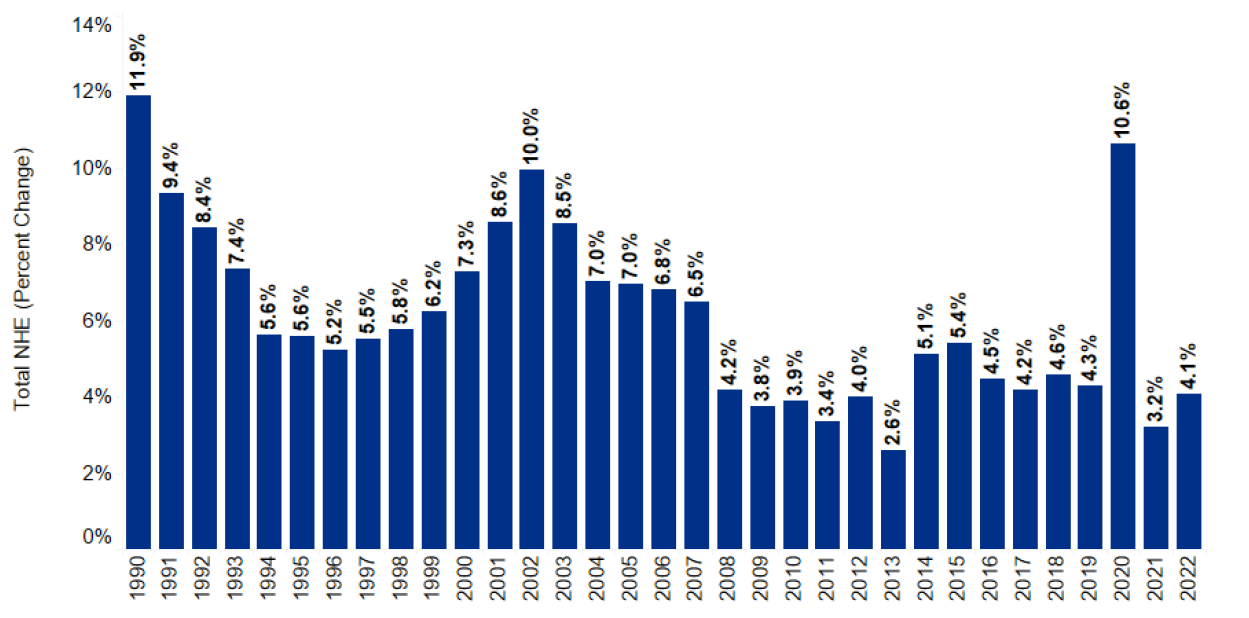
Source: Centers for Medicare & Medicaid Services, Office of the Actuary. Data released December 2023.
Notes:
(1) CMS completed a benchmark revision in 2019, introducing changes in methods, definitions and source data that are retroactively applied to the entire time series. For more information on this revision, see https://www.cms.gov/files/document/summary-benchmark-changes-2019.pdf
(2) National Health Expenditure (NHE) are expressed in the current year's dollar, 2022.
(3) In 2021, U.S. health care spending grew at a slower pace than in the previous year, totaling $4.3 trillion. This slowdown was primarily due to a decrease in federal government spending on health care, which had increased significantly in 2020 due to the COVID-19 pandemic. While there was greater use of health care services and an uptick in insurance coverage in 2021, these factors could not fully offset the reduction in federal expenditures. The percentages also change year over year, with most current percentages reflected in the chart. For more archived information on this decline, see https://www.cms.gov/newsroom/press-releases/national-health-spending-grew-slightly-2021
Chart 1.6: Annual Percent Change in National Health Expenditures (NHE) for Selected Health Services and Supplies, 2000-2022

Source: Centers for Medicare & Medicaid Services, Office of the Actuary. Data released December 2023.
Notes:
(1) CMS completed a benchmark revision in 2019, introducing changes in methods, definitions and source data that are retroactively applied to the entire time series. For more information on this revision, see https://www.cms.gov/files/document/summary-benchmark-changes-2019.pdf
(2) National expenditures for health services and supplies exclude medical research and medical facilities construction.
(3) “Other professional” expenditures include dental and other non-physician professional services.
(4)“Other” expenditures include net cost of insurance and administration, government public health activities, and other personal health care.
(5) Percentages may not sum to 100% due to rounding.
(6) Total NHE is expressed in the current year's dollar, 2022.
Chart 1.10: Total Prescription Drug Spending, 1980-2022
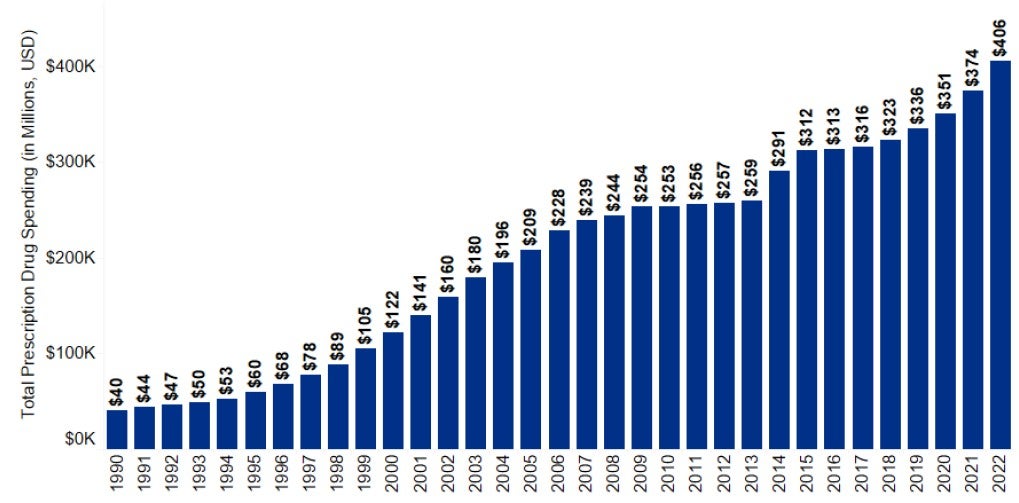
Source: Centers for Medicare & Medicaid Services. Data released December 2023. National Health Expenditures by types of service and source of funds, CY 1960-2022. https://www.cms.gov/files/zip/national-health-expenditures-type-service-and-source-funds-cy-1960-2022.zip
Notes:
(1) CMS completed a benchmark revision in 2019, introducing changes in methods, definitions and source data that are retroactively applied to the entire time series. For more information on this revision, see https://www.cms.gov/files/document/summary-benchmark-changes-2019.pdf
(2) Total Prescription Drug Spending is expressed in the current year's dollar, 2022.
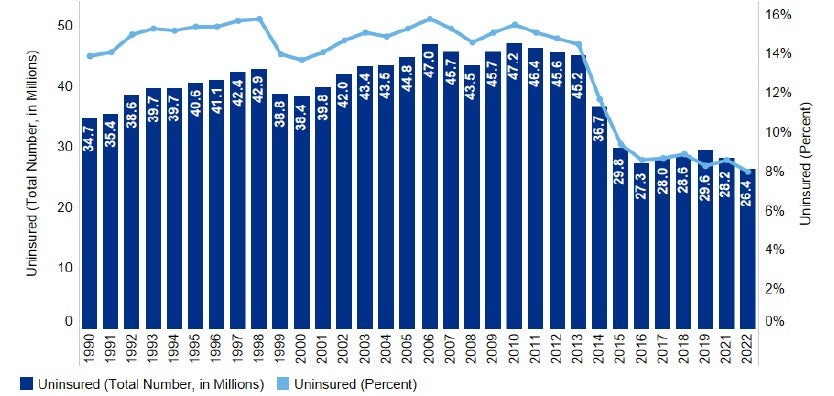
Chart 1.14: Number and Percent Uninsured, 1990-2019, 2021 and 2022
Source:
(1) Years 1990-2007: U.S. Census Bureau, Income, Poverty, and Health Insurance Coverage in the United States: 2007, Table C-1. https://www2.census.gov/library/publications/2008/demo/p60-235/p60-235.pdf
(2) Years 2008-2019, 2021, 2022: U.S. Census Bureau, American Community Surveys (ACS). Table HIC-4_ACS. Health Insurance Coverage Status and Type of Coverage by State All Persons (for years 2008 to 2019, 2021, 2022).
Note: Due to disruptions to data collection from the COVID-19 pandemic, the Census Bureau announced that the standard 2020 1-year ACS data products would not be released. For more information, refer to https://www.census.gov/programs-surveys/acs/technical-documentation/user-notes/2021-02.html#:~:text=The%20U.S.%20Census%20Bureau%20did,19%20pandemic%20on%20data%20collection