
Chart 1.14: Number and Percent Uninsured, 1990-2019, 2021-2023
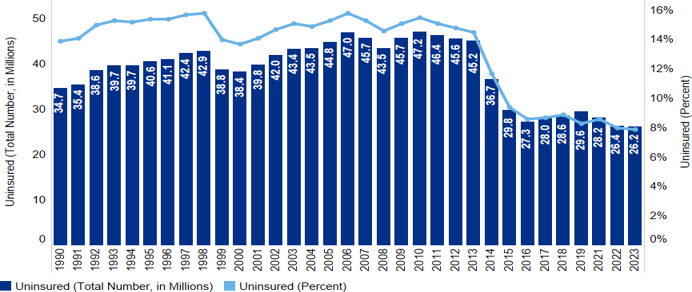
Source: U.S. Census Bureau, American Community Surveys (ACS). Table HIC-4_ACS. Health Insurance Coverage Status and Type of Coverage by State - All Persons (for years 1990 to 2019, 2021-2023).
Note: Due to disruptions to data collection from the COVID-19 pandemic, the Census Bureau announced that the standard 2020 1-year ACS data products would not be released. For more information, refer to this report