AHA Data in Action

Offering a Glimpse into the Possibilities of Our Data

REQUEST INFO


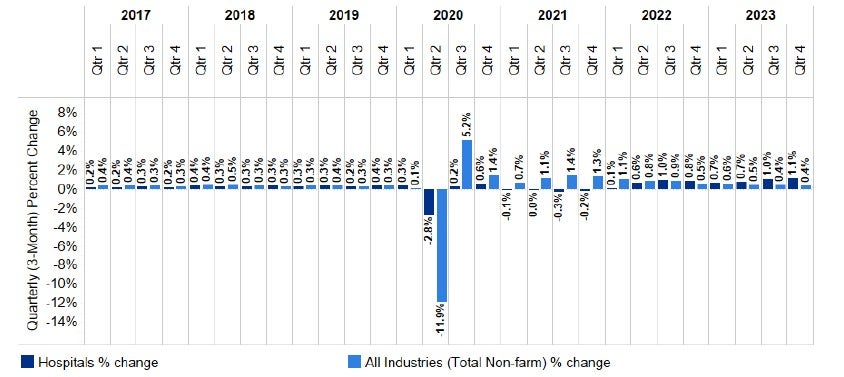
Chart 5.5: Percent Change in Employment, Seasonally Adjusted: Hospital vs. All Industries (Total Non-Farm), 2017-2022

Source: Analysis of American Hospital Association Annual Survey data, 1995 to 2021, for community hospitals.

Notes:

(1) Full-time equivalent employees per adjusted admission is an aggregate measure of workload reflecting the number of inpatient admissions, plus an estimate of the volume of outpatient services, expressed in units equivalent to an inpatient admission in terms of level of effort.

(2) Community hospitals included all non-federal, short-term general and specialty hospitals whose facilities and services are available to the public.


Source: Analysis of American Hospital Association Annual Survey data, 1995 to 2021, for community hospitals.

Notes:

(1) Full-time equivalent employees per adjusted admission is an aggregate measure of workload reflecting the number of inpatient admissions, plus an estimate of the volume of outpatient services, expressed in units equivalent to an inpatient admission in terms of level of effort.

(2) Community hospitals included all non-federal, short-term general and specialty hospitals whose facilities and services are available to the public. 

Interested in more insights like these?


Connect with us

Ready to learn even more about the AHA's rich dataset?

Get the hospital data you need to discover key insights delivered by a trustworthy source. Fill out the form and a representative will respond to you shortly.